¶ Main Dashboard
At a Glance
Route:/dashboard/main(also from bare/dashboardvia redirect) · For: Executive / Controller / HOD post-login · Status: Mock-data today; live wiring pending
¶ 1. What & Who
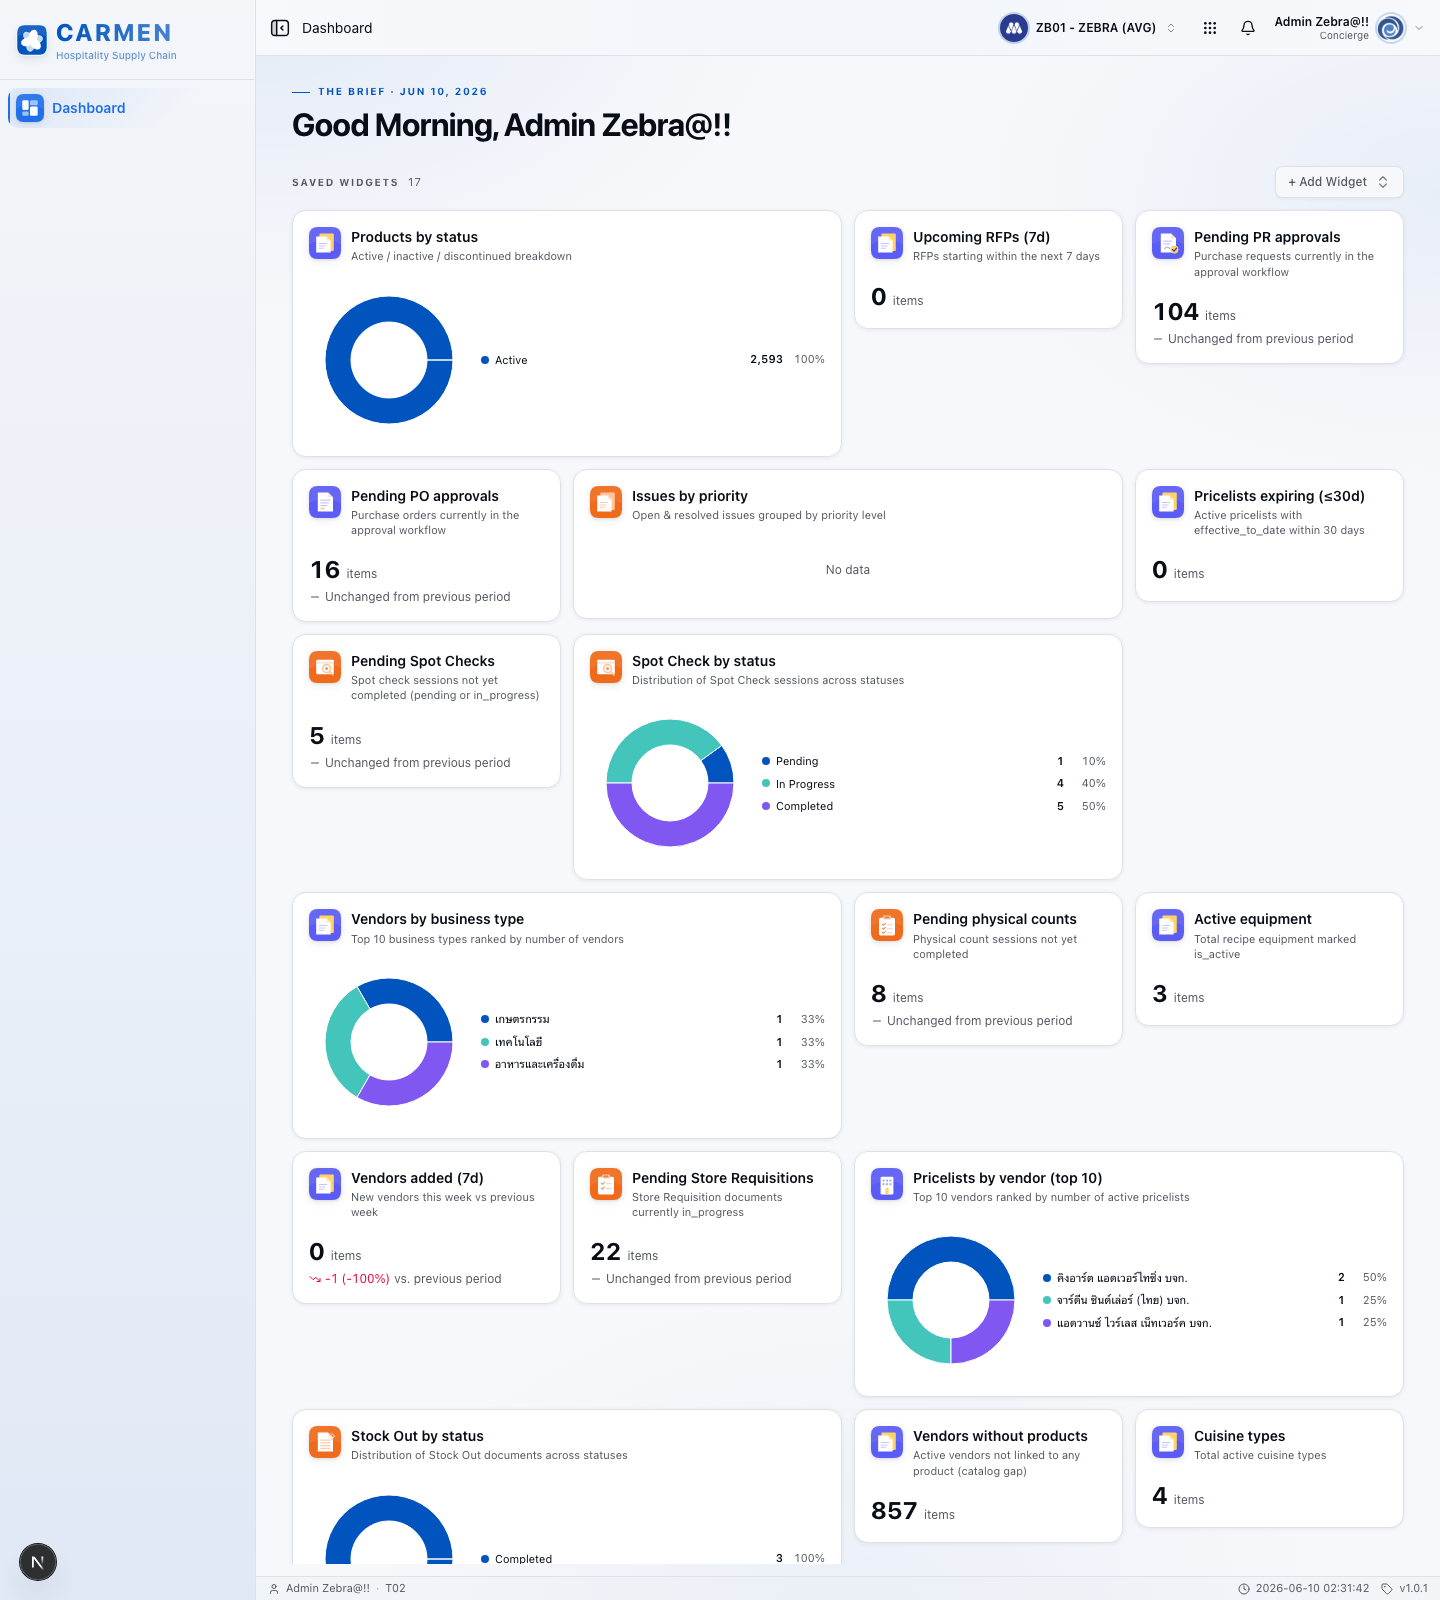
Post-login landing surface. Answers "how is the whole procure-to-pay chain doing this month?" — a single pane of cross-domain KPIs aimed at someone who needs a snapshot before drilling into a specific module.
Layout: 4 KPI cards (top) → 2 charts (middle: donut + bar) → 2 analysis blocks (PR pipeline bottleneck + top vendors).
Audience
- Executive / GM — 4 KPI cards + spend-by-department bar
- Procurement Manager — PR Pipeline bottleneck + Top Vendors
- Finance Controller — Budget Utilisation + spend-mix donut
¶ 2. Tiles & Drill-downs
| Tile | What it shows | Drill-down (when live) |
|---|---|---|
| Total Spend This Month | ฿ amount, ↑/↓ vs last month, % change |
(Inferred — to be verified) |
| Pending PRs Count | Integer + "HOD Approved, Awaiting Purchase" | → purchase-request |
| Open POs Count | Integer + "Waiting for Delivery" | → purchase-order |
| Actual Spend vs Budget | % progress bar 0–100 | (Inferred) |
| Spend by Material Group | Donut: Food / Beverage / Supplies / Chemicals / Others | — |
| Spend by Department | Bar: 5 departments, ฿ amounts |
— |
| PR Pipeline — Bottleneck | 6 stages (Saved / Committed / Awaiting HOD / Awaiting Purchase / Approved / Rejected) with count, ฿, bottleneck badge |
→ purchase-request |
| Top 5 Vendors by Spend | Vendor, total spend, PO count, avg delivery days | → vendor-pricelist |
Currency formatted via formatCurrency → ฿ + Thai locale grouping (th-TH).
¶ 3. Common Questions
| Question | Answer |
|---|---|
| Why aren't my tiles refreshing? | All tiles are mock-data today. Live hooks exist but are not yet mounted. |
| Where do the PR Pipeline numbers come from? | Will be group-count on purchase-request by workflow_current_stage once wired |
| Where is the live data path? | hooks/use-dashboard.ts (useMyPendingPrCount / useMyPendingPoCount / useMyPendingSrCount) and hooks/use-approval.ts (useApprovalPending) — wired to /api/proxy/api/my-pending/* and /api/proxy/api/approval/pending but not mounted on this page yet |
| What does the orange "Bottleneck" badge mean? | One stage holding more ฿ value than its expected share — flagged in mock/main.ts per-stage isBottleneck |
| Should the Budget tile reflect just this month or YTD? | Currently mock/main.ts shows month % only — production will source from a reporting-audit query dataset |
¶ 4. Troubleshooting
| Symptom | Cause | Action |
|---|---|---|
| Tile not clickable / drill goes nowhere | Drill-down routes not wired in current build | (Inferred — to be verified against live UI) |
| Numbers don't match the PR/PO sub-dashboards | Every dashboard reads its own independent mock today | Will resolve once all tiles read live endpoints |
Currency renders as $ instead of ฿ on some pages |
Mock fixture quirk on PR / PO / Inventory mocks | Production wiring should localise to BU base currency from master-data/exchange-rate |
| Tile shows zero or blank | Mock fixture intentionally seeded with that value | Inspect app/(root)/dashboard/mock/main.ts to confirm |
¶ 5. Data Sources (Dev)
When live wiring arrives, expected mapping:
- KPI cards — aggregate queries against purchase-request, purchase-order, ledger tables, plus a budget-vs-actual report from reporting-audit.
- Spend by Material Group / Department — grouped sum on PO/GRN lines joined to product-category and master-data/department.
- PR Pipeline — group-count on purchase-request by
workflow_current_stage. - Top Vendors — sum PO total amount grouped by
vendor_id, joined to vendor-pricelist.
Refresh cadence: static mock today. With live hooks: CACHE_DYNAMIC (1-min stale, 5-min gc), refetch on focus, no polling interval.
¶ 6. Related Modules
- dashboard — module index + sibling sub-pages
- dashboard/pr, dashboard/po — drill destinations for the PR Pipeline and Open POs / Top Vendors blocks
- purchase-request, purchase-order, good-receive-note — transactional sources behind every spend aggregate
- reporting-audit — query datasets that will back the spend-by-group and budget tiles
¶ 7. Reference Sources
- Page shell:
../carmen-inventory-frontend/app/(root)/dashboard/main/page.tsx - Composition:
../carmen-inventory-frontend/app/(root)/dashboard/_components/dashboard-main.tsx - Mock data:
../carmen-inventory-frontend/app/(root)/dashboard/mock/main.ts - i18n:
messages/en.json→dashboard.main.title= "Dashboard"